
Publishing more rarely fixes weak SEO. Content velocity metrics show whether your SaaS team, ecommerce brand, startup, or agency is building search momentum, or just pushing pages live.
What matters is pace tied to coverage, workflow, and refreshes (the part teams skip). If drafts stall in review or clusters stay half-built, traffic gets noisy and customer acquisition stays flat.
Start here:
- Separate new pages from refreshes in your monthly count
- Track days lost between brief, draft, review, and publish
- Watch which clusters earn impressions and commercial clicks, so you know what to fix next
What Content Velocity Metrics Actually Mean
Content velocity metrics tell you how quickly, consistently, and strategically your team creates, publishes, updates, and compounds content over time. That sounds simple, but most teams reduce it to one number: posts per month. That's too shallow to be useful.
If you're only counting output, you're missing the system underneath it. Modern SEO doesn't reward motion by itself. It rewards meaningful coverage around the topics you want to own.
Keep three dimensions in view:
- Publishing volume and consistency
- Content production throughput and workflow speed
- Topical and refresh coverage across priority subject areas
Those dimensions sound similar, but they do different jobs.
- Content velocity measures your overall publishing rate and operational pace.
- Content production throughput measures how efficiently content moves through the pipeline.
- Topic velocity measures how fast you cover an entire cluster deeply enough to matter.
- Refresh velocity measures how quickly you maintain and improve existing content.
That distinction matters in the real world. We've seen teams publish often and still stall because their cluster coverage is thin. We've also seen teams blame writers for slow output when the real problem was a review queue sitting untouched until Thursday afternoon.
The goal isn't to publish faster. It's to see where growth is being slowed by strategy, execution, or maintenance.
That shift calms people down. Good teams don't need more pressure. They need cleaner signals.
Why These Metrics Matter for Organic Traffic
Steady, structured publishing changes how search engines experience your site over time. Not in a magical way. In a practical way.
When your site keeps adding relevant, connected, indexable pages, a few things tend to happen:
- More URLs get discovered and indexed
- You create more entry points into search results
- Topic clusters start to reinforce each other
- Freshness improves in markets where recency still shapes clicks
Publishing frequency is not a direct ranking lever you can pull and expect instant gains. But it strongly affects the conditions that produce growth. That nuance gets lost all the time.
Output only starts compounding when it's paired with:
- clear topic selection
- semantic relevance
- internal links between hub and supporting pages
- regular updating of aging assets
Without that, you're just creating inventory.
For SaaS brands, ecommerce teams, agencies, and service businesses, the business impact is straightforward. More relevant pages can rank for more intents. Commercial gaps get covered faster. You rely less on one hero post carrying the whole program.
This is where the right metrics help. They break the anxiety loop. Instead of publishing inconsistently, checking rankings too early, and then overcorrecting, you can see whether the system is actually gaining momentum. Calm operators win here. Not frantic ones.
The Core Content Velocity Metrics Every Team Should Track
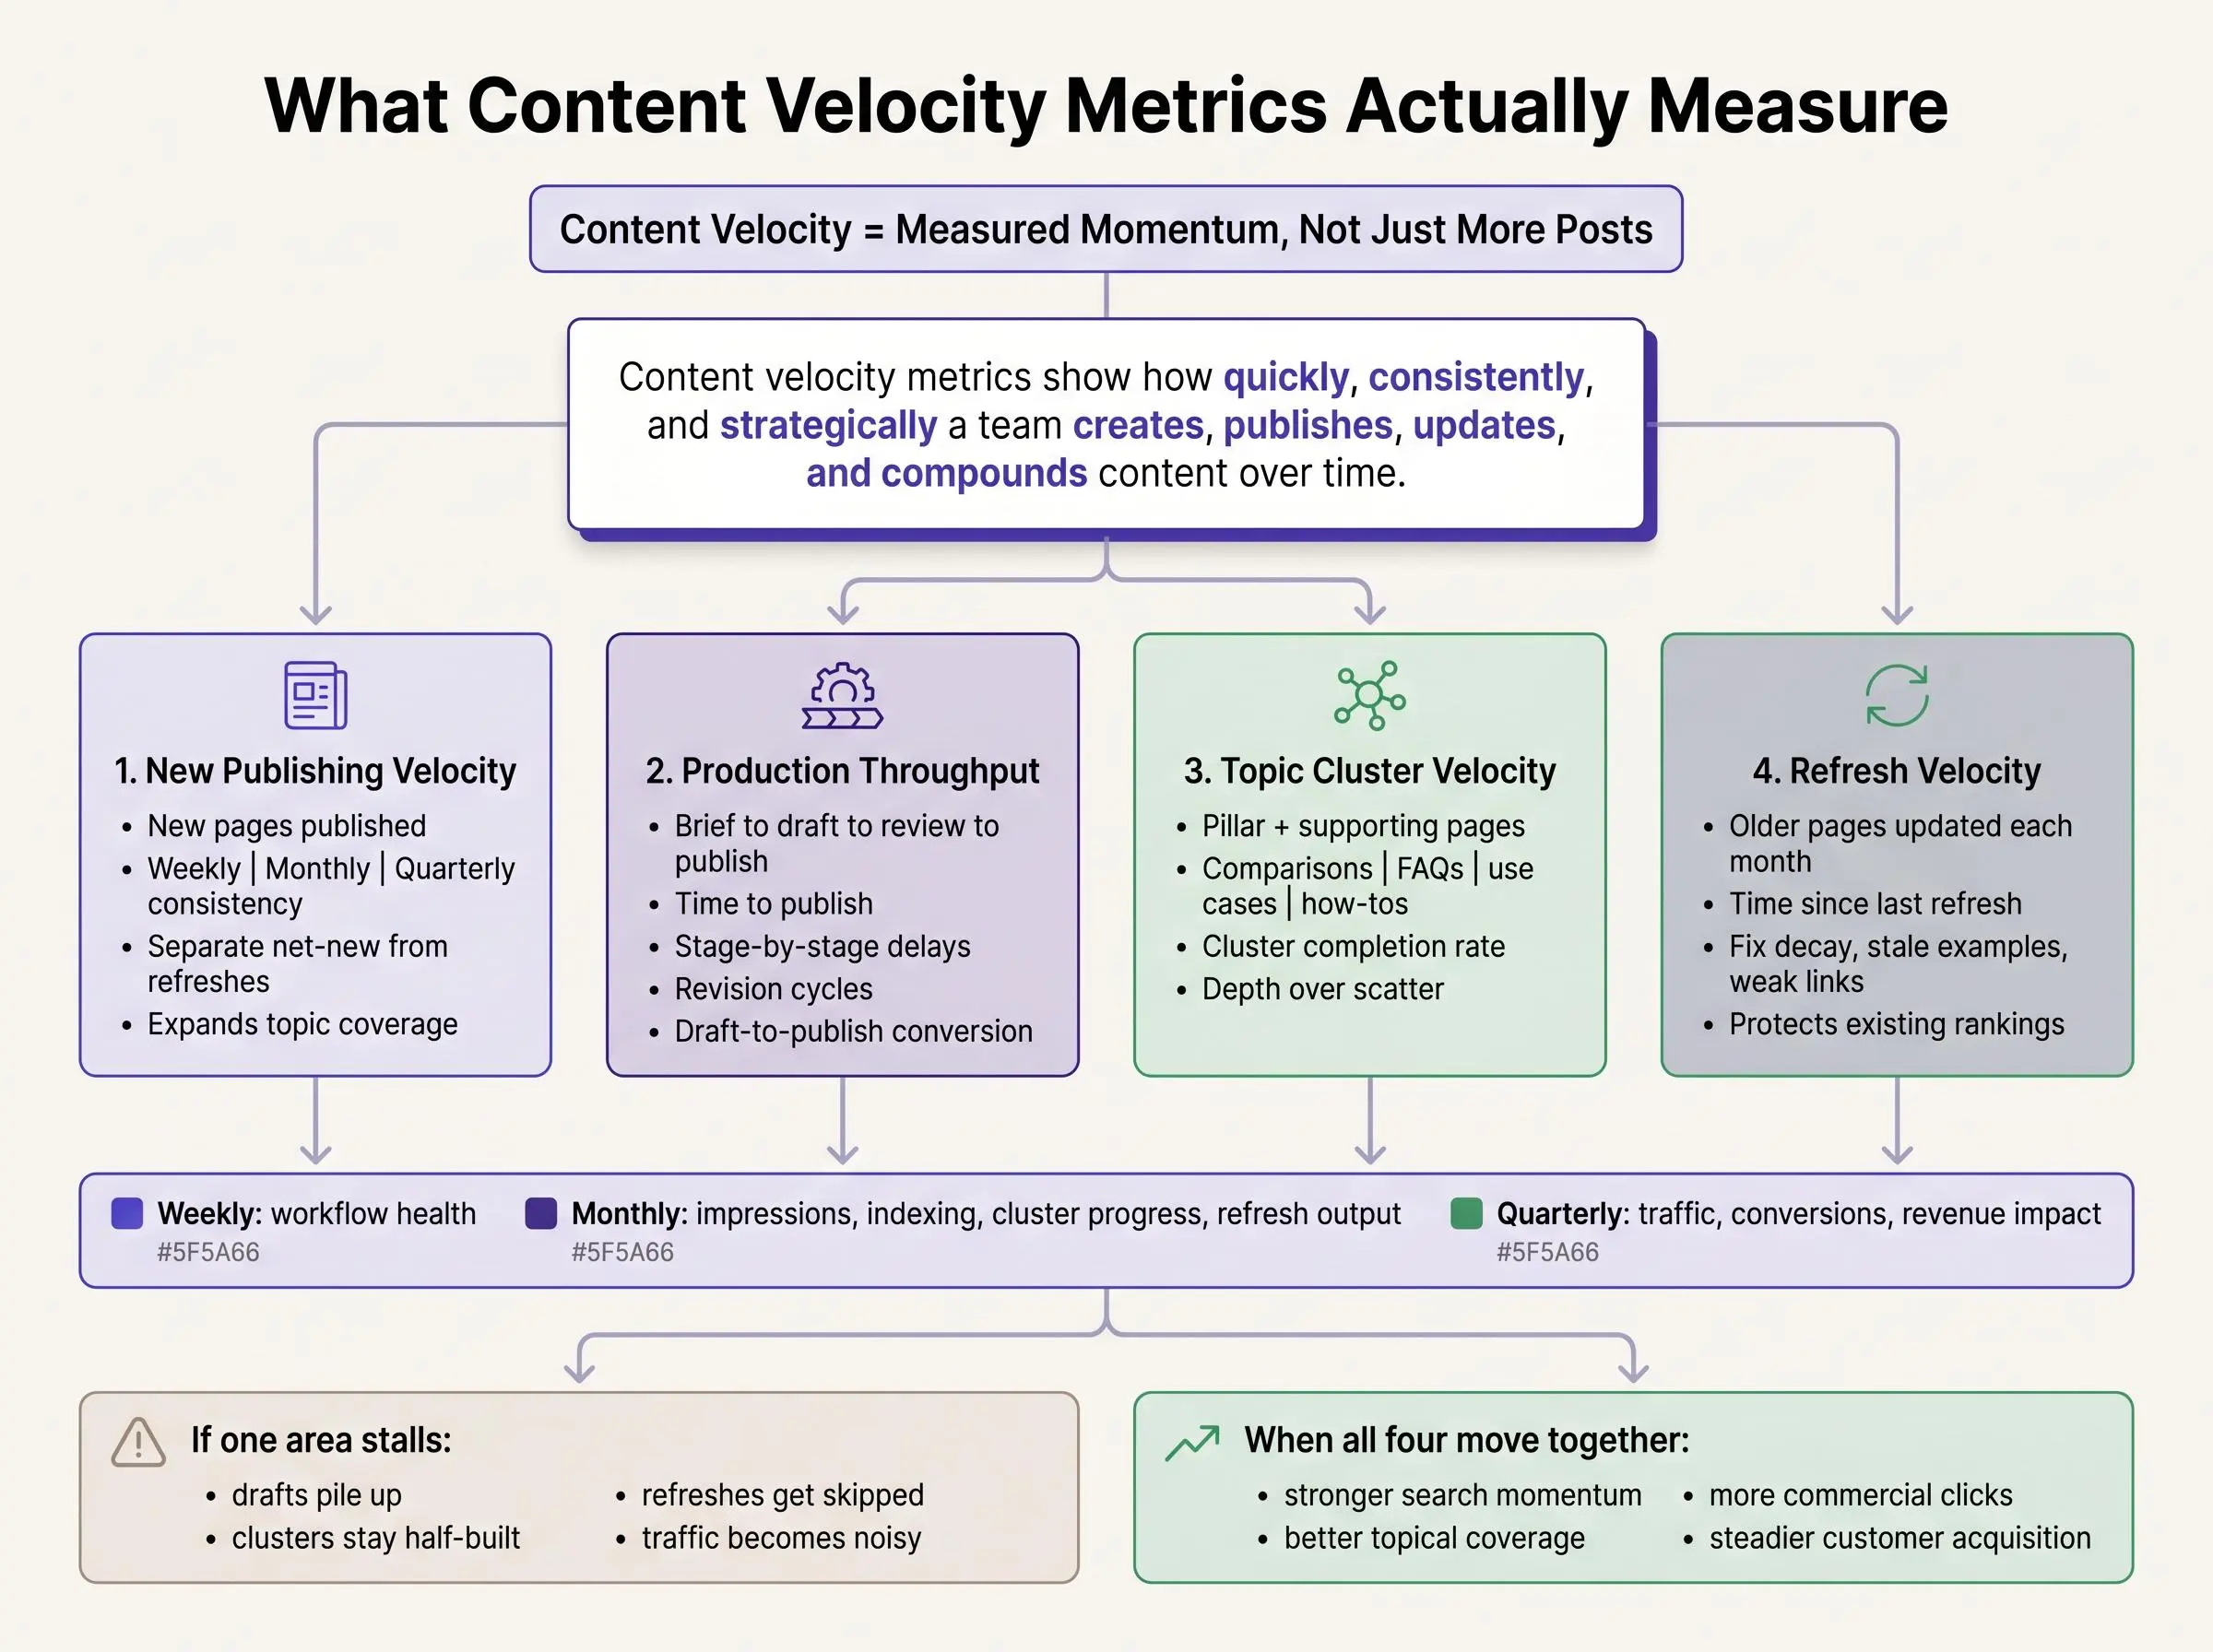
You don't need fifteen dashboards and a pile of vanity charts. You need a small set of content ops performance metrics tied to SEO outcomes. This is the practical core.
The operational metrics
Start with the metrics that show whether work is actually moving.
Publishing frequency
Track new pieces published weekly, monthly, and quarterly. Split new content from refreshed content so you don't inflate output with updates.Content production throughput
Measure how many quality-approved pieces move from brief to published in a given period. This shows team capacity, not writer busyness.Time to publish
Track total cycle time from idea to live page. If it takes 24 days to publish a 1,200-word article, something is broken.Stage-by-stage workflow time
Break cycle time into ideation, briefing, drafting, editing, approval, formatting, and publishing. Bottlenecks hide in the handoffs.Revision cycle count
Count how many review rounds each piece needs. High revision counts usually mean weak briefs, unclear standards, or too many opinions in the room.Draft-to-publish conversion rate
Measure how many drafted pieces actually go live. Abandoned drafts are wasted throughput.
The SEO momentum metrics
Then track whether output is turning into search visibility.
Topic cluster completion rate
Measure how quickly pillar pages, supporting articles, comparisons, FAQs, and refreshes are completed within a cluster.Time to first organic impression
Track how long a page takes to appear in search data after publication. It's an early signal for discoverability and indexing health.Coverage growth
Count how many published pages are earning impressions and how that number expands over time.Refresh rate
Measure how many older pages are updated each month and how long key pages go without revision.
The outcome metrics
Finally, connect output to value.
Traffic yield per content batch
Compare groups of pages by month, campaign, or cluster to see which batches actually move organic traffic.Conversion or pipeline contribution
Tie velocity to demo requests, leads, assisted conversions, revenue influence, or ecommerce actions.
A simple way to use the metrics together
Imagine a SaaS team reviewing one topic cluster at the end of the month. Its content log labels each page as new or refreshed and records the cluster, content type, brief date, draft date, approval date, live date, revision count, first organic impression date, and relevant conversion action. The team can then run this checklist:
- Confirm output. Count only quality-approved pages that are live, separating new pages from refreshes.
- Find the delay. Compare each workflow stage instead of relying only on the overall time to publish.
- Check concentration. Compare the pages completed in the cluster with the remaining pillar, supporting, comparison, FAQ, and refresh work.
- Check search movement. Review which published pages have begun earning impressions and whether older pages are overdue for updates.
- Check business relevance. Connect the batch to leads, assisted conversions, pipeline, or ecommerce actions where tracking exists.
- Choose one follow-up. Fix the slowest handoff, complete the next high-priority cluster page, or schedule a refresh rather than changing the whole program.
This keeps the dashboard tied to a decision. A high draft count with a low draft-to-publish conversion rate points to unfinished work; a normal publishing rate with weak cluster completion points to scattered prioritization; and strong output with no search or business signal calls for a review of intent, coverage, and commercial pathways.
A blunt truth here: velocity without outcomes is just activity wearing a dashboard.
| Metric | Category | What it tracks | Why it matters |
|---|---|---|---|
| Publishing frequency | Operational | New pieces published weekly, monthly, and quarterly, separated from refreshed content | Shows real output without inflating production with updates |
| Content production throughput | Operational | Quality-approved pieces that move from brief to published in a given period | Shows team capacity rather than writer busyness |
| Time to publish | Operational | Total cycle time from idea to live page | Reveals when the publishing system is broken or moving too slowly |
| Stage-by-stage workflow time | Operational | Time spent in ideation, briefing, drafting, editing, approval, formatting, and publishing | Helps find bottlenecks hidden in handoffs |
| Revision cycle count | Operational | How many review rounds each piece needs | High counts usually signal weak briefs, unclear standards, or too many opinions |
| Draft-to-publish conversion rate | Operational | How many drafted pieces actually go live | Shows whether drafts are turning into published output or being abandoned |
| Topic cluster completion rate | SEO momentum | How quickly pillar pages, supporting articles, comparisons, FAQs, and refreshes are completed within a cluster | Shows whether output is building concentrated coverage around a topic |
| Time to first organic impression | SEO momentum | How long a page takes to appear in search data after publication | Provides an early signal for discoverability and indexing health |
| Coverage growth | SEO momentum | How many published pages are earning impressions and how that count expands over time | Shows whether more of the site is gaining search visibility |
| Refresh rate | SEO momentum | How many older pages are updated each month and how long key pages go without revision | Shows whether aging content is being maintained before it decays |
| Traffic yield per content batch | Outcome | Traffic performance of groups of pages by month, campaign, or cluster | Shows which batches actually move organic traffic |
| Conversion or pipeline contribution | Outcome | Demo requests, leads, assisted conversions, revenue influence, or ecommerce actions tied to content velocity | Connects publishing pace to business value |
How to Measure Publishing Efficiency Without Rewarding the Wrong Behavior
Teams game themselves when they measure article count in isolation. It feels objective, but it rewards the wrong behavior fast. Shorter pieces. Easier topics. Lower standards. Lots of motion, very little lift.
A better approach is a balanced scorecard. Combine operational metrics with SEO performance and business outcomes so no one metric gets too much power.
Here are the rules we recommend:
Only count content that clears a real editorial standard
If it isn't publishable, it isn't output.Separate strategic pages from filler
A comparison page targeting purchase intent should not be treated the same as a low-stakes trend post.Segment by content type
Product comparisons, landing pages, glossary entries, and refreshes require different effort. One blended metric hides too much.Track new content and updates separately
They do different SEO jobs. New pages expand coverage. Refreshes protect and grow existing wins.Review on different time windows
Weekly for workflow health when they publish 16 or more posts per month instead of four or fewer, especially when those posts are tightly concentrated in a topic area.
- Growth-focused teams may scale to 20 to 30 articles per month, while slower publishers often sit around 5 to 8.
- New sites sometimes front-load 50 to 100 pages in the first six months to accelerate search surface area.
- Some operators push 15 to 25 articles in month one and then 10 to 15 per month through months two to six for brand-new sites.
Those numbers illustrate momentum. They do not justify thin content, scattered targeting, or a publishing sprint that collapses by month three.
Newer sites often need front-loaded coverage because they have little topical footprint to begin with. Established sites usually benefit more from a steady publishing rhythm and disciplined refresh cycles. Different problems. Different pacing.
Use benchmarks in three ways:
- Compare against competitors in your topical neighborhood
- Compare against your own last 90 and 180 days
- Compare against what your workflow can sustain without quality slipping
The most useful benchmark isn't someone else's article count. It's the rate at which your own high-intent clusters turn into rankings and customers.
How to Diagnose What Is Actually Breaking Down
This is where metrics become useful instead of interesting. Patterns tell you what kind of problem you have.
Common signal patterns
High publishing volume but low impressions
Usually weak topic selection, poor intent alignment, or shallow coverage.Fast drafting but slow publication
Usually approval loops, formatting delays, or CMS friction.Strong output across many topics but weak rankings
Usually topical scatter. Too much spread, not enough depth.Good early visibility that fades
Usually neglected refreshes.High revision counts
Usually unclear briefs, inconsistent brand rules, or poor source quality.Plenty of traffic but weak conversions
Usually the wrong intent mix or weak commercial pathways.
For SaaS teams, a common failure mode is publishing thought leadership quickly while comparison and bottom-of-funnel pages sit in draft review for weeks. Ecommerce brands often publish blog content regularly but leave category pages and buying guides untouched. Agencies can generate volume, then lose half their speed inside client approvals.
Use a simple diagnostic workflow
Run this review at the end of each reporting period:
- Start with the symptom. Choose one signal that moved in the wrong direction, such as slower time to publish, lower impressions, or weaker conversion contribution.
- Trace it one stage upstream. If publication slowed, compare drafting, editing, approval, formatting, and publishing time instead of blaming the whole pipeline.
- Check the strategic context. If impressions or rankings are weak, review intent alignment, cluster concentration, internal links, and the balance between new pages and refreshes.
- Name one likely bottleneck. Write a testable cause, such as “approval is delaying comparison pages” or “new articles are spread across too many clusters.”
- Choose one corrective action. For example, set a review owner, finish the next supporting pages in one cluster, or prioritize aging pages for refresh.
- Recheck the same metric. Keep the review focused on the original symptom so you can tell whether the intervention helped.
Use this decision rule: fix the earliest stage that is clearly slowing the outcome. A stalled approval queue comes before asking writers to draft faster; weak topic selection comes before increasing publishing volume; neglected refreshes come before launching another batch of new pages.
Don't overhaul everything at once. Find the single biggest drag on measured momentum and fix that first. Most content systems don't have ten serious problems. They have one or two expensive ones.
Topic Velocity Is What Turns Output Into Authority
General publishing speed is not the same as topic velocity. Topic velocity measures how quickly you cover a cluster deeply enough to matter.
Search engines respond better to concentrated expertise than random publishing across unrelated keywords. A connected set of pages helps reinforce entity understanding and intent coverage. That's where authority starts to look real.
Strong topic velocity usually includes:
- a pillar or hub page
- definitions and explanatory posts
- comparisons
- how-to content
- use-case pages
- FAQs
- refreshes as the topic evolves
- internal links tying support pages back to the core
For a SaaS company, that cluster might include problem-aware articles, use-case pages, competitor comparisons, integration pages, and refreshes tied to product changes. For ecommerce, it might include category explainers, product comparisons, buying guides, seasonal refreshes, and FAQ support.
We've seen smaller teams publish less total content and still win because they moved tightly through one cluster at a time. Meanwhile, bigger teams published everywhere and built very little.
That's why content velocity metrics get much more useful at cluster level. Total site output can flatter a weak strategy. Cluster progress can't.
Refresh Velocity Is the Hidden Metric Most Teams Ignore

Most teams overfocus on net-new publishing while older pages quietly decay, and streamlined CMS publishing. Used well, AI is not a shortcut to flood the site. It's a way to remove manual drag from research, drafting, optimization, publishing, and refresh prioritization.
That's the lane we care about at Intelliminds. Automating topic research, article writing, publishing, and content refreshing helps teams scale content team efficiency without giving up strategic judgment.
Faster output only pays when the content still earns rankings, clicks, links, and conversions. Otherwise you're just producing cheaper waste.
Common Mistakes That Distort Content Velocity Metrics
This is the reality check. A lot of content programs look productive because the measurement is loose.
Watch for these distortions:
- counting drafted pieces, outlines, or approvals as output instead of only live content
- measuring article count without tracking time to publish, first impressions, or cluster performance
- treating random publishing across unrelated topics as progress
- ignoring updates and only celebrating net-new production
- chasing competitor volume without understanding their authority, age, or team structure
- running short-term publishing sprints that the system can't sustain
- using one blended metric for all content types
- assuming velocity will fix weak intent targeting or thin semantic coverage
- optimizing for traffic alone without checking customer acquisition impact
A busy content machine can still be a weak growth engine. That's the trap.
Conclusion
Content velocity metrics are not about pushing your team to publish endlessly. They're about measuring whether your content system is building momentum in the right direction.
The framework is simple enough to run:
- track volume, throughput, topic coverage, and refresh cadence together
- use seo output benchmarks as context, not orders
- diagnose bottlenecks before asking for more output
- connect SEO activity to traffic and business outcomes
If you want a clean next step, audit the last 90 days. Look at publishing frequency, time to publish, draft-to-publish conversion, cluster completion, refresh rate, and early search performance. Then find the one breakdown hurting momentum most.
Fix that first.
More content is not always the answer. Better measured momentum usually is.
Article Record
ReferencesPrimary sources used for this article
- Creating Helpful, Reliable, People-First Content
- Content Velocity: What It Means and Why It Matters Now
- The 12th Annual Blogger Survey: What Content Works in 2025?
- The new content operating model
- Content Velocity: The Complete Explanation | Storyblok
- Content Velocity Frameworks: Publish Faster Without Losing Quality | Ten Speed
- AIO Impact on Google CTR: September 2025 Update
Update HistoryMeaningful revisions to this article
- Added a practical example to the core content velocity metrics section, making it easier for teams to understand how to apply the metrics in their own work.
- Added a practical example to the section on diagnosing content performance issues, making the guidance easier to apply.
- Clarified how to identify what is breaking down so readers can take more informed action.
- Linked the existing Intelliminds mention to its product page for easier access to related information.
- Improved the article’s usefulness by connecting readers to a relevant owned resource without changing the main guidance.