
content performance metrics get messy fast when you track everything and learn nothing. We've seen growing brands obsess over traffic spikes while the pages that actually pull signups, product clicks, and revenue get ignored.
You need a tighter filter: visibility, engagement, conversion, and what happens after the visit. If you run ecommerce, SaaS, services, or an agency, these are the numbers that show what to scale, fix, or refresh. Better calls, less guesswork.
How to Think About Content Performance Without Getting Lost in Vanity Metrics
Most teams don’t need more numbers. They need a better filter.
Pageviews, reach, and social mentions can tell you that something was seen. They do not tell you whether that article built trust, moved a buyer forward, or helped acquire a customer. That’s the gap. If you want real content performance metrics, you need to read content the way an operator reads a pipeline.
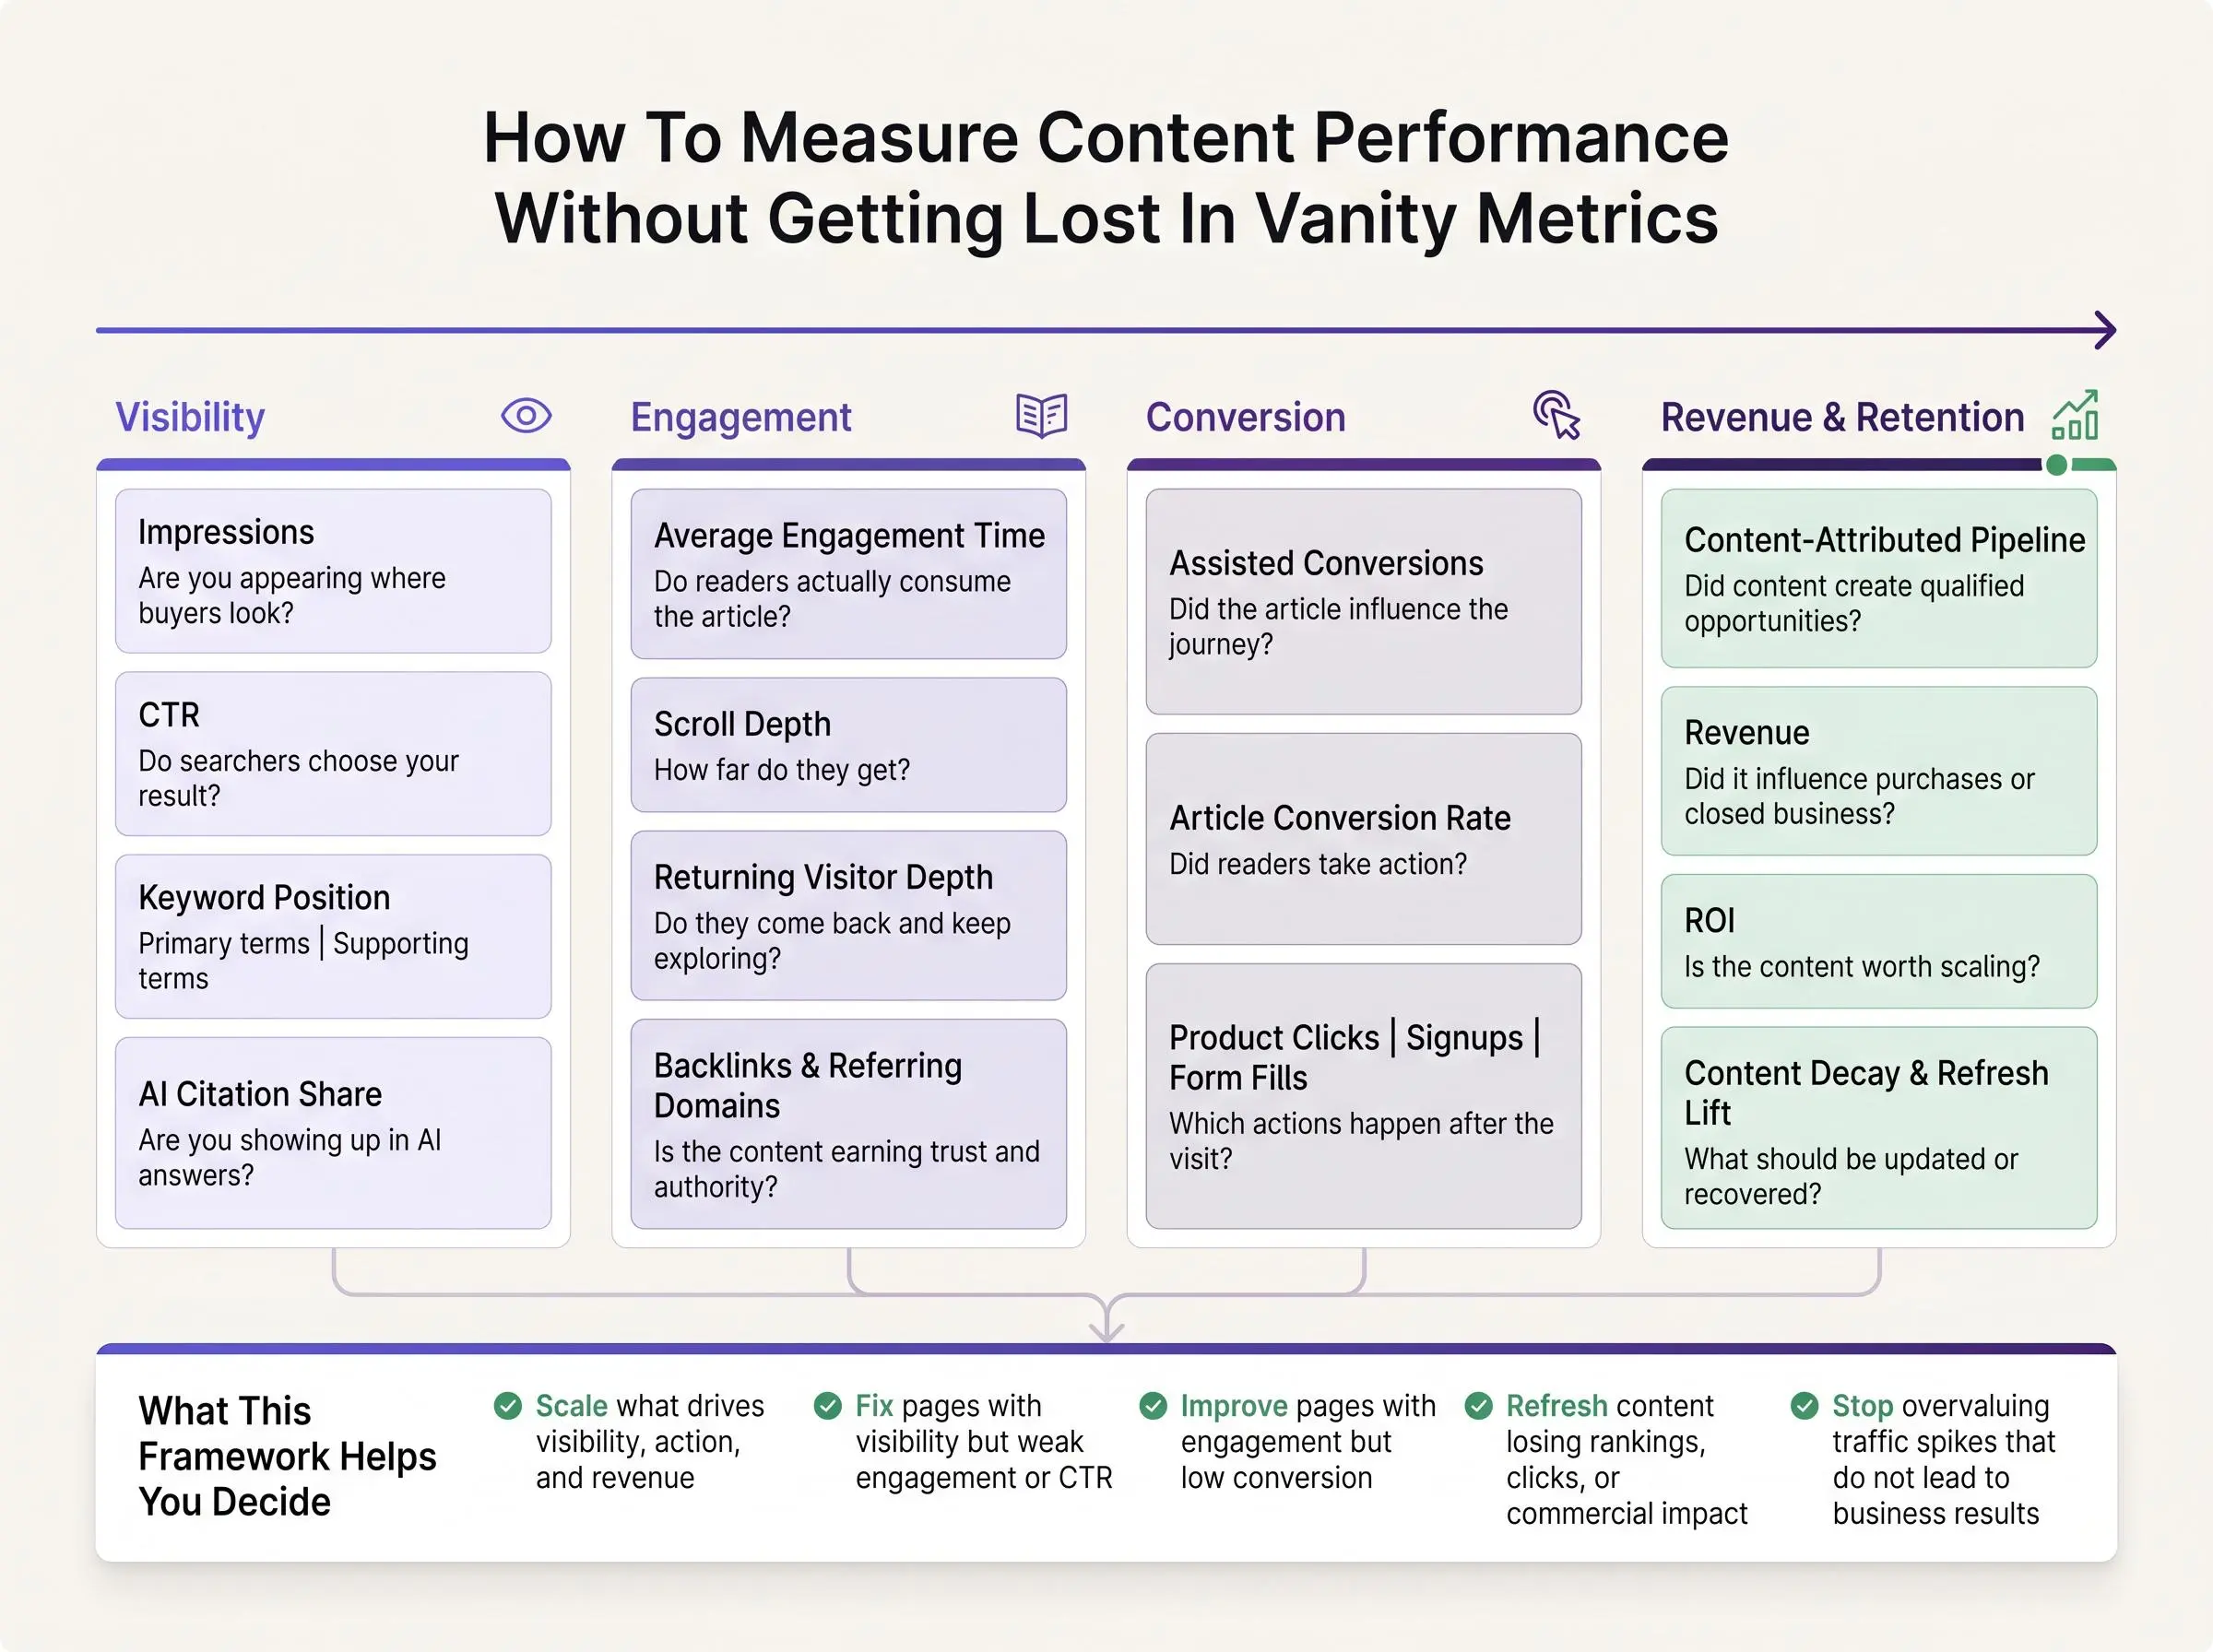
We use a simple four-layer lens:
- Visibility: are you appearing where buyers look?
- Engagement: do people actually consume and trust the content?
- Conversion: does the article move someone to act?
- Revenue or retention: does that action turn into commercial value?
Google Search Central advises assessing whether content is original, substantial, trustworthy, and satisfying for readers—not merely whether it attracts visits from search engines. Those qualities give your engagement and conversion metrics more meaning than raw visibility alone.
That framing matters more now because click-based reporting is less complete than it used to be. AI summaries, answer engines, and zero-click behavior mean influence often starts before the visit, and sometimes ends without one. If you only track clicks, you’ll miss part of the story.
The scale is no longer marginal. A 2026 clickstream analysis estimated that 68.01% of U.S. Google searches ended without a click in the first four months of the year, versus 60.45% in 2024. It also estimated that open-web clicks fell from 374 to 276 per 1,000 searches. The two estimates use different panels, so treat the change as directional rather than a perfectly like-for-like trend—but the reporting implication is clear: impressions, brand presence, and citation visibility deserve their own place beside traffic.
Another mistake we see a lot is judging every article in isolation. In practice, clusters win. One article earns impressions, another captures the click, and a third supports the conversion later. Single-page analysis has its place, but cluster momentum usually tells you more about whether your SEO content kpis are working.
Stage matters too. A newer content program should care a lot about indexing, impressions, and early rankings. A mature program should be harder on itself. At that point, assisted conversions, pipeline, refresh lift, and ROI matter more.
Good SEO reporting should reduce noise, not create it.
If you’ve been wondering what metrics matter for SEO content, this is the practical answer. Not every metric deserves equal weight. The right ones tell you what to publish next, what to improve, and what to stop pretending is working.
1. Organic Search Impressions
Impressions are the number of times your article appears in search results, whether someone clicks or not. Simple metric. Very useful early.
For newly published content, impressions are often the first reliable sign that search engines understand the topic and consider the page relevant enough to test. Before traffic arrives, impressions tell you whether your topic choice and intent alignment were at least directionally right.
A few patterns are worth watching:
- Low impressions often mean weak topic targeting, poor indexing, or low relevance
- Rising impressions with no clicks usually point to a snippet problem, not necessarily a bad article
- Cluster-wide impression growth is often the first sign topical authority is building
We track impressions at both the page and cluster level for that reason. A single article can look quiet while the surrounding cluster is gaining traction. That’s not failure. That’s usually the system warming up.
2. Organic Click-Through Rate
CTR is the percentage of impressions that become clicks. Impressions tell you you’re visible. CTR tells you whether searchers pick you.
This is one of the cleanest ways to measure article success because it sits right in the middle of discovery and visit. You can have a strong article and still underperform if the title tag is vague, the meta description is generic, or the search snippet doesn’t match intent.
A few practical fixes tend to move CTR faster than people expect:
- tighten title structure
- lead with specificity
- match the phrasing buyers actually search
- remove empty language that says nothing by the second read
If an article has healthy impressions and weak CTR, don’t rush to rewrite the whole page. Fix the SERP promise first. We’ve seen good content hidden behind mediocre packaging more times than we can count.
3. Average Position for Primary and Supporting Keywords
Average position shows the typical ranking of an article for the queries it targets. Useful, but only when handled carefully.
A blended ranking number across everything is not very helpful. We separate primary keywords from supporting long-tail terms because they tell different stories. Primary rankings show whether the page is competing for the core topic. Supporting terms show whether the content has enough depth to win breadth.
Look at the combinations:
- Rankings up, clicks flat: the snippet or intent match is off
- Primary term weak, supporting terms strong: the article has depth but may lack focus
- Rankings down over time: competition increased, relevance slipped, or the content is decaying
This is one of the most familiar seo content kpis, but it becomes a vanity metric fast when tied to keywords that don’t matter commercially. Ranking for a term no buyer cares about is not progress. It’s just movement.
4. Organic Traffic Growth Rate
Raw traffic totals can hide a lot. Growth rate is usually the better signal.
Organic traffic growth rate measures change over time, usually month over month or quarter over quarter. It shows momentum. That matters because two articles with the same traffic today can be on very different paths. One is compounding. The other peaked six months ago and is sliding.
We like to compare growth in three cuts:
- Page level for individual winners and losers
- Cluster level to spot topical momentum
- Content type level to see whether guides, comparisons, or category pages are compounding differently
This is one of the most practical organic growth metrics because it helps allocate effort. If one content type keeps breaking out while another stalls, that should shape your roadmap. But traffic growth alone isn’t enough. Growth without engagement or conversion is activity, not leverage.
5. Average Engagement Time per Active User
This metric tracks how long users actively engage with the article, not just how long the tab stays open. That makes it far more useful than the old time-on-page numbers people used to overread.
For informational SEO content, engagement time helps answer a blunt question: after the click, did the article actually hold attention? In many article formats, two minutes or more can be a healthy sign. Not a law. Just a practical benchmark.
Low engagement time usually points to one of four issues:
- the article overpromised in search
- the opening took too long to get useful
- the structure made the page hard to scan
- the content was thinner than the query deserved
A weak intro can kill a good article. We’ve seen that happen even when the core material was solid by the middle of the page. Most readers never make it there.
6. Scroll Depth
Scroll depth shows how far readers move down the page, often as a percentage or milestone event. It helps you see whether people consume the piece or leave after a quick skim.
For long-form blog content, getting readers past 50 percent is often a healthy sign. Not because every article needs full-page completion, but because it suggests the page is carrying attention beyond the opening.
The useful part is in the contrast:
- High engagement time, low scroll depth can mean users got what they needed early
- Low engagement and low scroll usually means weak relevance or poor formatting
- Sharp drop-off before the CTA often means you buried either the payoff or the action too far down
This metric is especially helpful when diagnosing section-level friction. If readers consistently disappear around the same point, the content is telling you where it loses them. Most teams just don’t listen.
7. Backlinks and Referring Domains
Backlinks are links from other sites to your article. Referring domains are the number of unique sites sending those links. Related metrics, but not the same thing.
For SEO articles designed to become reference assets, this matters because links still strengthen authority and discoverability. But raw link count can be misleading. A handful of relevant, credible domains usually beats a pile of weak ones.
Strong backlinks often validate that your article has something competitors don’t, such as:
- clearer original structure
- deeper supporting detail
- a cleaner explanation of a messy topic
- a resource people actually want to cite
Brand mentions and social shares can increase awareness, but they don’t always strengthen search equity in the same way. Different signals. Different job.
Watch which topics earn links naturally. Those themes often deserve more investment because they compound beyond a single article.
8. AI Citation Share
AI citation share measures how often your brand, page, or domain is cited, mentioned, or drawn from in AI-generated answers for relevant queries. It is a visibility measure—not a replacement for traffic or conversion reporting.
One reason to keep it on the dashboard is that citation status and organic click-through can move together. In a Seer Interactive analysis of 3,119 informational and educational queries across 42 organizations, Q3 2025 organic CTR averaged 0.70% when the brand was cited in an AI Overview, compared with 0.52% when an AI Overview appeared without a citation. Queries without an AI Overview averaged 1.45%.
That is a useful reporting distinction: an AI citation may coincide with better click-through than being uncited on the same kind of AI Overview query, while AI Overview queries in this sample still drew fewer organic clicks than queries without an overview.
Citation and click-through should be reported together, not treated as interchangeable. The cited-versus-uncited difference is useful for monitoring, but it does not prove that a citation caused more clicks: cited brands may already have stronger authority or baseline performance. Compare the same stable query set over time, and separate AI Overview queries from queries without one before making optimization decisions.
9. Returning Visitor Depth
Returning visitor depth tracks whether people come back and how deeply they continue engaging across sessions. For SaaS, services, and considered ecommerce purchases, this matters more than many teams realize.
A one-time visit can be useful. A repeat visit is often a trust signal.
We look at a few behaviors together:
- repeat visits per user
- return session frequency
- movement from articles into higher-intent pages later
An article that brings fewer visitors but keeps pulling the right readers back can be more valuable than a traffic-heavy post that never creates a second session. That’s especially true when your sales cycle is not impulse-driven.
This metric also tells you whether your content strategy is building an audience or just renting attention for a moment.
10. Assisted Conversions
Assisted conversions are conversions where the article influenced the journey but was not the final touchpoint. For B2B and higher-ticket offers, this is one of the most important metrics on the list.
Educational content often works as trust infrastructure. It helps buyers understand the problem, validate options, or feel ready to take the next step later. If you judge those articles only by last-click leads, you’ll under-credit some of the most useful content in the program.
A better approach is to pair assisted conversion data with path analysis and internal-link review. Then you can see whether top-of-funnel pages are actually bridging into demos, product pages, or contact forms.
This is one of the clearest answers to what metrics matter for SEO content when the buying journey isn’t linear. And most buying journeys aren’t.
11. Article Conversion Rate
Article conversion rate is the percentage of article visitors who complete a target action, such as a signup, form submission, product click, or purchase. This is where content stops being a publishing exercise and starts acting like an acquisition system.
Directional benchmarks help keep expectations sane:
- B2B SaaS blog content: around 1 to 3 percent
- Local service businesses: around 3 to 7 percent
- Ecommerce content: around 0.5 to 2 percent
If conversion rate is low, don’t assume the article is bad. The issue may be a weak CTA, poor offer alignment, or an internal-link path that asks readers to make too big a leap.
Intent matters here. Informational guides, comparison pages, and bottom-funnel articles should not all be judged on the same curve. Operators know that. Founders should too.
| Business type | Directional benchmark |
|---|---|
| B2B SaaS blog content | 1 to 3 percent |
| Local service businesses | 3 to 7 percent |
| Ecommerce content | 0.5 to 2 percent |
12. Content-Attributed Pipeline or Revenue
This metric ties article performance to actual money: qualified pipeline, purchases, or closed revenue influenced by content. Eventually, this is the metric leadership cares about.
Traffic reports rarely answer budget questions. Revenue does.
It helps to separate:
- direct revenue, where the article drove the conversion itself
- influenced revenue, where the article helped but wasn’t the final step
That split prevents educational content from being undercounted. For long-term reporting, the ROI formula is straightforward: (revenue attributed to content minus content cost) / content cost × 100.
This closes the loop on all the earlier content performance metrics. Visibility starts the story. Revenue finishes it.
13. Content Decay and Refresh Lift
Content decay is the gradual decline in impressions, rankings, clicks, or conversions after an article peaks. Every serious SEO program deals with it. The only question is whether you track it early or notice it late.
Content is not finished when it’s published. It becomes an asset that can gain or lose value over time.
The operational move is to measure refresh lift against a consistent pre- and post-update window, looking at:
- impressions
- CTR
- rankings
- traffic
- conversions
That gives you a real read on whether the update worked. Not every page deserves a refresh. Decay signals help you prioritize the ones with recoverable upside.
This is also where connected systems matter. When topic research, writing, publishing, and refresh workflows run off the same signals, you move faster and make better calls. That’s where a platform like Intelliminds becomes useful. The dashboard doesn’t just report the past. It helps drive the next action.
What Ranking Pages’ Update Dates Suggest About Refresh Timing
A refresh calendar should reflect how quickly a query’s results change, not a universal rule. In a Siege Media analysis of SERPs for 17,749 keywords representing nearly 234 million monthly searches, the average last-update date among ranking pages was 730 days across all keyword variants. But pages ranking for “best software” terms were much fresher, at 143 days on average; broader “best” terms averaged 400 days and rates terms 496 days.
That makes query type a useful prioritization signal alongside your own decay data. A two-year-old explainer is not automatically stale, while a comparison or software-selection page may face a much faster-moving SERP.
These are observed average update dates among ranking results, not proof that updating a page on the same schedule will improve rankings. The study’s keyword sample and publication dates may not represent every industry, and an on-page date can reflect a minor update rather than a full refresh. Use the pattern to set an audit queue, then validate refresh lift with consistent pre- and post-update windows.
How to Build a Blog Reporting Dashboard That Leads to Better Decisions

A strong blog reporting dashboard should answer decisions, not just display activity. If a metric doesn’t change what you do next, it probably doesn’t belong on the main view.
We recommend grouping reporting into four sections:
- Visibility: impressions, CTR, rankings, AI citation share
- Engagement: engagement time, scroll depth, returning visitor depth
- Conversion: assisted conversions, article conversion rate
- Revenue: pipeline, revenue, ROI, refresh lift
Keep the main dashboard lean. The deeper analysis can live elsewhere. Most teams make the mistake of stuffing every number into one screen, then nobody trusts it by the second week.
Different stakeholders need different views:
- Executive ROI view for pipeline, revenue, and cost efficiency
- Manager performance view for clusters, growth rate, and conversions
- Diagnostic operator view for snippet issues, decay, path friction, and refresh candidates
Segmentation is where reporting becomes useful. Break performance down by article, topic cluster, funnel stage, traffic source, and content age. You want to know whether new content is ramping, whether refreshed content is recovering, and whether certain clusters are carrying too much of the program.
A steady review cadence works well:
- weekly for traffic and engagement
- monthly for conversions and attribution
- quarterly for full content audits against cost and outcomes
One small thing makes a big difference: add an action column beside each article or cluster. Use labels like scale, rewrite, improve snippet, strengthen CTA, consolidate overlap, or refresh. That turns a blog reporting dashboard into an operating tool.
When reporting, publishing, and refreshing live in separate workflows, teams lose speed. When they connect inside one system, the dashboard becomes a decision engine.
Frequently Asked Questions About Content Performance Metrics
What are content performance metrics for SEO articles?
Content performance metrics are the signals you use to judge whether an SEO article is doing its job. In this article, those signals span four layers:
- Visibility: impressions, CTR, rankings, AI citation share
- Engagement: engagement time, scroll depth, returning visitor depth
- Conversion: assisted conversions, article conversion rate
- Revenue or retention: pipeline, revenue, ROI, refresh lift
Together, they show more than whether an article was seen.
Which metrics matter most for new SEO content?
For newer content, the article says to pay close attention to indexing, impressions, and early rankings. Those metrics help you confirm that search engines understand the topic and are testing the page. Early CTR and engagement signals also help you see whether the snippet and opening are working.
Why isn’t traffic alone enough to measure article success?
Traffic can be misleading because it only shows that people arrived. The article emphasizes that a page can attract visits without building trust, moving a buyer forward, or contributing to revenue. That’s why you also need engagement, conversion, and commercial metrics to understand real performance.
How should I judge whether a refresh worked?
Measure refresh lift against a consistent pre- and post-update window. The article recommends looking at:
- impressions
- CTR
- rankings
- traffic
- conversions
That makes it easier to tell whether the update improved performance or not.
What’s the difference between assisted conversions and article conversion rate?
Assisted conversions are cases where the article influenced the journey but was not the final touchpoint. Article conversion rate is the percentage of article visitors who complete a target action, such as a signup, form submission, product click, or purchase. One measures contribution across the journey; the other measures direct action from the page.
Conclusion
The best content performance metrics don’t just describe what happened. They tell you what to create, improve, and refresh next.
That means looking beyond traffic alone. You need visibility signals like impressions and rankings, engagement signals like active time and scroll depth, conversion signals like assisted and direct actions, and commercial signals like pipeline, revenue, and ROI. Then you need to watch decay, because every article has a lifecycle whether you manage it or not.
Start simple. Pick a focused set of metrics for each cluster. Review them on a steady cadence. Treat every SEO article like an asset that can appreciate or drift.
That’s the shift. Content is not done when it’s written. It’s managed through evidence.
If your reporting system isn’t helping you decide what to research, publish, update, and scale, tighten it until it does. Guesswork is expensive. A connected system is not.
Article Record
ReferencesPrimary sources used for this article
- Creating helpful, reliable, people-first content
- Key events attribution paths report
- Get started with attribution
- 5-Step Content Marketing Measurement Framework
- Content Performance: 16 Metrics to Track Your Results
- Content performance: How to track and create a site that keeps people coming back
- Content Performance Tracking: Key Metrics and Tools (2026) - Shopify
- How to Measure Content Marketing Success in 2026 | Ten Speed
- AIO Impact on Google CTR: 2026 Update
- 2024 Zero-Click Search Study: For every 1,000 EU Google Searches, only 374 clicks go to the Open Web. In the US, it’s 360.
- Conceptualising and measuring social media engagement: A systematic literature review
Update HistoryMeaningful revisions to this article
- Added a chart showing how recently ranking pages were updated across different “best software” search queries.
- Made refresh timing easier to understand by comparing update dates across 17,749 keywords.
- Added a chart to the “AI Citation Share” section to make the study’s click-through-rate findings easier to understand.
- Clarified how organic click-through rates differed when AI Overviews included citations, did not include citations, or did not appear.
- Added recent clickstream insights to explain why click-only reporting no longer gives a complete picture of content performance.
- Made the metrics guidance more useful by showing how no-click searches affect the way article results should be evaluated.
- Added guidance from Google Search Central to clarify how to evaluate content performance beyond vanity metrics.
- Made the opening section more useful by connecting content measurement with creating helpful, people-first content.
- Added a 5-question FAQ section under “Frequently Asked Questions About Content Performance Metrics.”
- Expanded the article with reader-focused answers to common questions about measuring content performance.