
Most content reports look busy but fail when leadership asks what content actually did for growth. Marketing performance reporting breaks when it stops at traffic, rankings, and screenshots.
What matters is a system you can use when attribution gets messy. We don't need more charts. We need a clean link between content work and customer acquisition.
Start here:
- Split branded and non-branded organic
- Track refresh ROI separately from new pages
- Tie content to leads or pipeline before you ask for budget again
Why Content Reporting Still Feels Hard to Defend
Most teams don't have a reporting shortage. They have a credibility problem.
There are more dashboards, more screenshots, more exported charts than ever, yet leadership still asks the same question at the end of the month: is content actually driving efficient growth? If that question still hangs in the room, the report failed.
The old model breaks down for a few reasons:
- Privacy changes have reduced clean click-level visibility.
- Platform reporting is fragmented, and each platform tends to over-credit itself.
- SEO compounds slowly, so a 30-day view often understates the real return.
- Leadership wants business answers, not activity updates.
That gap creates bad behavior. Content teams get reactive. They start defending sessions, impressions, and rankings as if those numbers speak for themselves. They don't.
A traffic chart without commercial context is just motion.
There's also a broader market problem here. A lot of marketers still admit their analytics don't translate cleanly into action. Surface metrics can look healthy while real commercial impact stays fuzzy. That's the data mirage. It feels like measurement, but it doesn't support a decision.
Better marketing performance reporting isn't about adding more charts. It's about linking content inputs, performance signals, and business outcomes into one story that a skeptical operator can actually believe.
What Marketing Performance Reporting Means for Content ROI
Let's define this plainly. Marketing performance reporting is the structured process of collecting, analyzing, and presenting marketing data so you can evaluate effectiveness, make decisions, and show business impact.
For content and SEO, that definition needs to get tighter. A useful report connects:
- topic choices
- publishing consistency
- ranking gains
- organic traffic quality
- conversions
- revenue contribution
It also needs to do two jobs at once. It should show what's working now, and it should help leadership understand whether future growth is strengthening or weakening.
Content ROI reporting is different from general channel reporting because content behaves differently. The payback curve is longer. Older pages can keep producing leads or sales without proportional new spend. Refreshes can materially improve results from assets you already own. That changes how return should be measured.
What counts as return
In content reporting, return can include:
- qualified organic traffic
- lead generation
- assisted conversions
- pipeline influence
- customer acquisition
- reduced dependency on paid acquisition over time
What counts as investment
Don't undercount the cost side. Investment includes:
- strategy and topic research
- writing and editing
- publishing and optimization
- content refresh work
- tools and internal team time
If you only measure last-touch conversions and ignore the compounding nature of content, you'll make content look weaker than it is. If you ignore the real effort behind it, you'll make it look stronger than it is. Both mistakes lead to bad decisions.
The smarter mindset is to treat content ROI as a performance system to manage, not a one-time case to plead.
Start With the Questions Leadership Actually Wants Answered
Executive SEO reporting should not start with whatever metrics are easiest to export from your tools. It should start with the decisions leadership is trying to make.
In practice, most leaders want answers to a short list of questions:
- Is organic content contributing to revenue or pipeline growth?
- Are we acquiring customers more efficiently over time?
- Which content themes are driving business results?
- Are new articles and refreshes paying back?
- Should we invest more, hold steady, or reallocate budget?
If your report doesn't answer those, you're asking leadership to do the interpretation themselves. They won't. Or worse, they'll fill in the gaps with assumptions.
We frame every report around four lenses:
- Business outcomes: leads, pipeline, revenue, customer acquisition
- Leading indicators: non-branded traffic, rankings on valuable topics, conversion signals
- Efficiency: output relative to return, and whether organic is lowering acquisition pressure
- Next actions: what to publish, refresh, pause, or measure better
Audience matters too. Founders and CEOs want growth and efficiency. CMOs want channel contribution and planning confidence. Finance leaders want a cleaner line between investment and return. Agency clients want proof of progress, not a list of deliverables completed by Friday afternoon.
Good reporting changes the conversation. You stop defending content as a cost center and start managing it as a growth lever.
Build a Metrics Hierarchy That Connects Content to Revenue
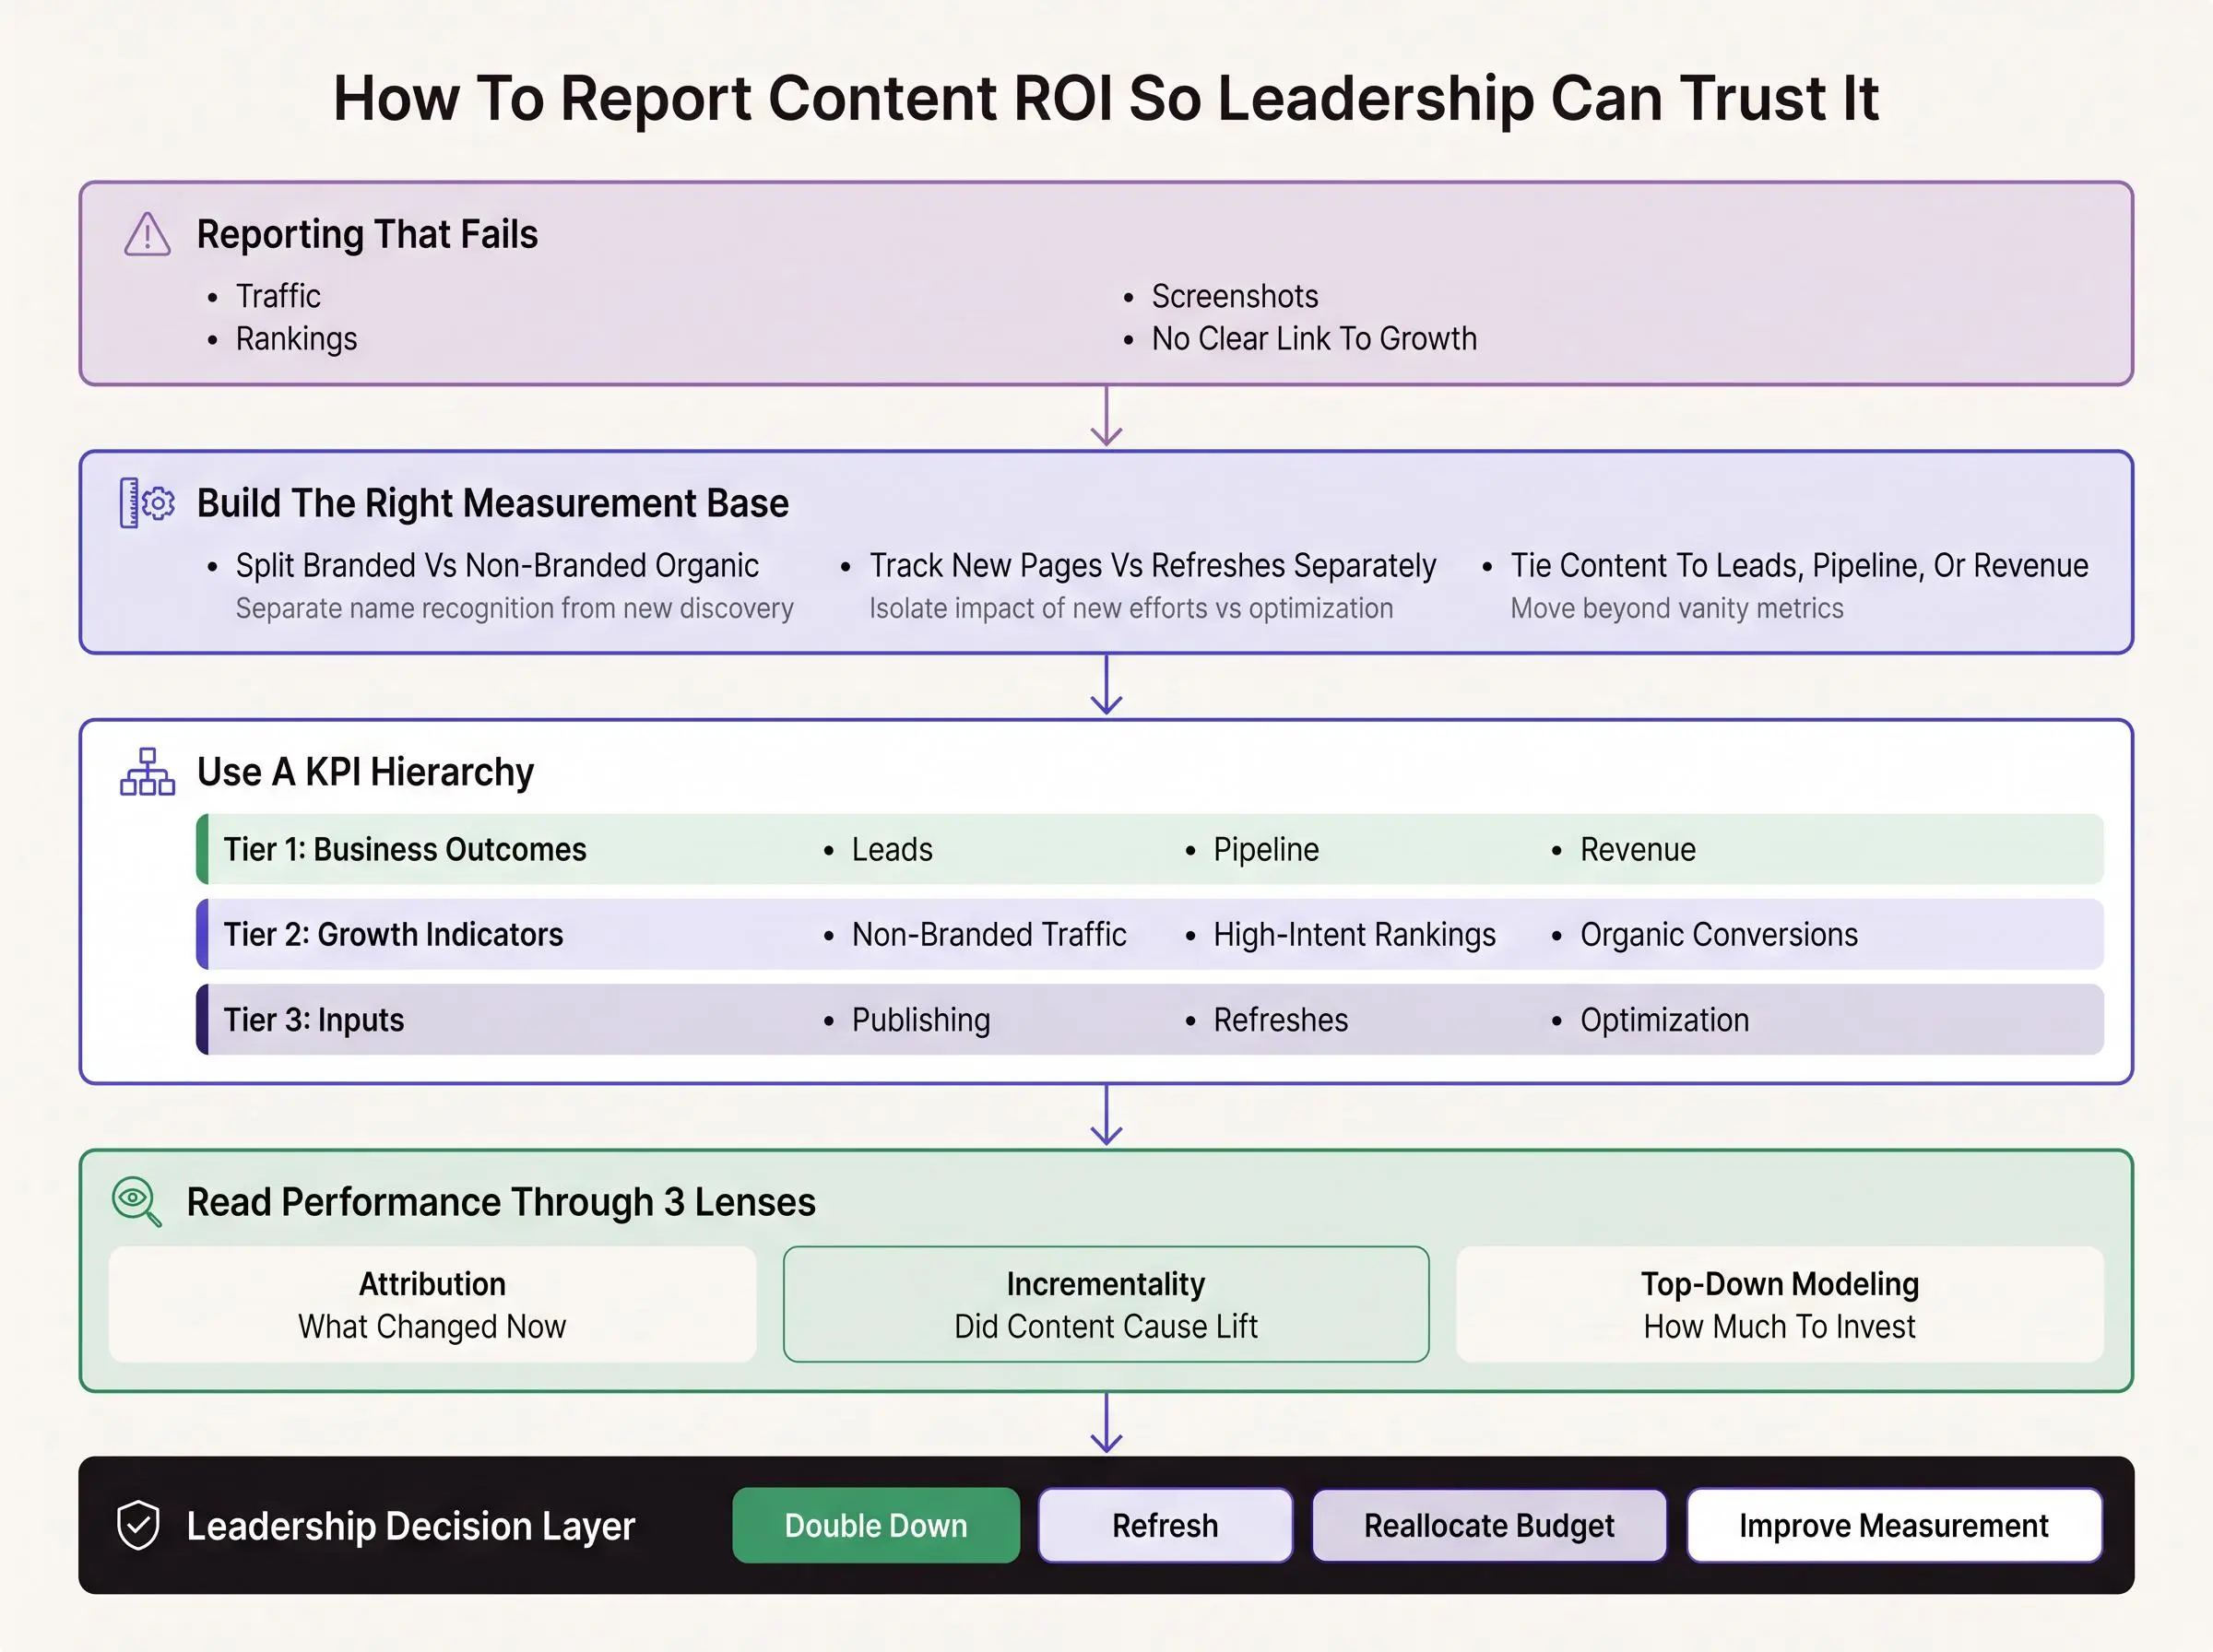
A clean report needs a strict KPI hierarchy. Otherwise teams jump between board-level claims and page-level details with no thread connecting them.
Here's the structure we use.
Tier 1: business outcomes
This is the top layer. If leadership only sees one thing, it should be this.
- revenue influenced by organic content
- pipeline or qualified lead contribution
- customer acquisition impact
- broader marketing efficiency signals, where relevant
Tier 2: growth indicators
These show whether the engine is strengthening.
- non-branded organic traffic
- rankings for commercially relevant topics
- conversions from organic landing pages
- assisted conversions and multi-session journeys
- share of traffic or conversions from high-intent content
Tier 3: production and optimization inputs
This layer explains why performance is moving.
- publishing velocity
- topic coverage by funnel stage
- refresh volume
- internal linking improvements
- indexation or technical readiness, if it materially affects results
Tier 4: diagnostic metrics
Useful for operators. Rarely useful for executives on their own.
- impressions
- click-through rate
- engagement depth
- page-level conversion rate
- content decay or lift after refresh
If a metric can't be tied upward to a business outcome, it belongs lower in the report.
This hierarchy prevents a common failure mode: optimizing for numbers that look impressive but don't change the business. It also helps you show blog impact to executives without flooding them with page-by-page noise.
What should be de-emphasized in executive views? Raw traffic without intent context. Rankings without topic value. Engagement metrics without any relevance to conversion paths. Those are supporting signals, not the headline.
Show the Full Content-to-Customer Journey, Not Just Last-Touch Credit
Content rarely gets a fair read in last-touch reporting. That's not because content doesn't work. It's because people don't buy that neatly.
A typical content journey looks more like this:
- topic opportunity identified
- article published or refreshed
- ranking and visibility improve
- relevant organic visits arrive
- conversion happens on page or in a later session
- lead gets qualified or customer purchases
- revenue or pipeline gets influenced downstream
If you only report the last step, organic often looks weaker than reality. If you only report the first half, it looks fluffy. You need the full chain.
Segmentation is what makes the story believable. Break the journey into slices that reflect how the business actually works:
- branded vs non-branded organic traffic
- blog vs product-adjacent educational content
- new articles vs refreshed articles
- top, middle, and bottom-of-funnel content
- clusters by product line, service category, or audience segment
This is where a lot of teams get sharper. Leadership can see which themes attract attention, which assets move people closer to purchase, and where publishing more would likely create the next layer of growth.
Content does not need to close every sale directly to deserve budget. If it consistently creates qualified demand and lowers acquisition friction, it's doing real work.
Use Three Measurement Lenses Instead of Trusting One Number
One number is never enough. Strong marketing performance reporting triangulates.
Attribution for operational feedback
Attribution is useful for fast feedback. It helps you spot which pages, topics, and conversion paths appear to be performing right now. That's valuable for weekly optimization.
But attribution has limits. It can over-credit correlation. It loses signal under privacy constraints. And platform-native attribution often tells a version of the story that's a little too flattering.
Incrementality for causal validation
Incrementality asks a harder question: did this actually cause lift beyond what would've happened anyway?
That's useful for validating bigger content initiatives, branded pushes, or support effects across channels. It's narrower and slower, so it isn't practical for everything. But for higher-stakes decisions, it matters.
Top-down modeling for budget decisions
Broader modeling approaches help answer channel allocation questions. They're better for strategic planning than for page-level content decisions. You won't use them to decide whether to refresh one article this week. You will use them when leadership is deciding how much to invest in organic versus other channels.
The division of labor is pretty simple:
- attribution answers what changed this week
- incrementality answers is this causing lift
- top-down modeling answers how much should we invest overall
For content ROI, that usually means attribution for operational reporting, periodic causal checks for higher confidence, and broader allocation models when budget conversations get real.
The direction of travel across the market is clear. Teams are moving toward integrated measurement systems because fragmented analytics create fragmented decisions.
Build a Content ROI Dashboard for Leadership That Gets Used

A team dashboard and a leadership dashboard are not the same thing. If yours are identical, one of them is wrong.
Team dashboards can be detailed and messy. Leadership dashboards need to be concise, comparative, and decision-oriented. That's the foundation of a useful content ROI dashboard for leadership.
What should be in the executive layer
Your top layer should include:
- a short executive summary with 3 to 5 key takeaways
- organic-sourced leads, pipeline, or revenue where available
- assisted conversion trends
- non-branded organic traffic trend
- conversion rate from key content groups
- top-performing topics or content clusters
- performance lift from refreshes
- top wins, risks, and next actions
Then tell the story in four beats:
- What changed
- Why it changed
- What it means for growth
- What we're doing next
What should stay in supporting detail
Keep these out of the top layer unless someone asks:
- page-by-page exports
- every keyword movement
- unfiltered engagement metrics
- screenshots from individual platforms
Those details belong underneath, not on the cover page.
Cadence matters too. Weekly internal reporting is for optimization. Monthly reporting is usually right for leadership visibility. Quarterly reviews are where you go deeper on budget, strategy, and measurement calibration.
A dashboard gets used when it reduces interpretation work. That's the test.
Report on Compounding Value, Not Just This Month’s Traffic
Short reporting windows are brutal on content. They make a compounding asset look like a slow campaign.
A better way is to report performance by publish cohort:
- articles published this month
- articles published in the last 3 to 6 months
- older evergreen assets still generating traffic and conversions
That one shift changes how leadership sees the program. Content starts to look like an asset base, not just a monthly output count.
Refresh reporting matters just as much. Track decaying pages. Show lift after updates to titles, search intent alignment, examples, internal links, or outdated information. Then compare the return of refreshes against net-new content. Sometimes the best use of budget isn't another article. It's fixing the 20 that are already halfway there.
That's an operator's view, not a writer's view.
You should also report on execution discipline:
- topic discovery quality
- publishing cadence
- refresh cadence
- consistency over time
For lean teams, consistency is the hidden variable. When inputs are chaotic, reporting gets noisy. When workflows are repeatable, the signal gets much cleaner. That's one reason platforms like Intelliminds can help. If topic planning, article production, scheduling, publishing, and refresh workflows are more consistent, the reporting gets easier because the inputs are trackable in the first place.
To prove organic growth value, show both the outcomes and the engine creating them.
How to Report Content Marketing ROI to Leadership Without Sounding Defensive
If you're wondering how to report content marketing ROI to leadership, the answer is mostly about structure and tone.
Start with the business result. Then connect it to the content activity that contributed. Show the leading indicators that support the trend. Be honest about risks or measurement gaps. Recommend the next action.
A simple executive narrative works well:
- what we published or refreshed
- what changed in visibility and qualified traffic
- how that affected conversions, pipeline, or acquisition
- what we learned about topics, intent, and funnel movement
- what we'll do next month or quarter
Notice what's missing. No metric dump. No apology tour.
When measurement is imperfect, say so clearly. Be transparent about what is directly measurable. Show directional evidence where full revenue linkage isn't available. Use multiple signals instead of making oversized claims from one number. Leaders trust measured confidence more than forced certainty.
If you want to show blog impact to executives, use language they already trust:
- demand creation
- customer acquisition
- pipeline influence
- efficiency improvement
- reduced pressure on paid channels
Also, isolate non-branded organic performance where possible and highlight commercially relevant pages or clusters. That helps prove organic growth value instead of accidentally taking credit for existing brand demand.
Include one slide or one page that asks for decisions:
- where to double down
- where to refresh
- where to stop investing
- where better measurement is needed
Strong reporting reduces debate because it makes action obvious.
The Biggest Mistakes That Make Content Reporting Unconvincing
Most weak reports fail in familiar ways. Not because teams are careless, but because they report what is easy to pull instead of what is useful to decide.
Watch for these mistakes:
- reporting traffic without business context
- treating rankings as the final goal instead of a leading indicator
- using platform-native attribution as if it were complete truth
- ignoring assisted conversions and delayed conversion paths
- failing to separate branded growth from true topic-led acquisition
- reporting only net-new content while overlooking refresh ROI
- showing too many charts and too little interpretation
- avoiding uncertainty instead of explaining it clearly
- delivering reports that describe the past but offer no next move
- using AI outputs or automated analysis without enough transparency, governance, or data quality checks
That last one is creeping up fast. Automation can help, but black-box reporting creates a new version of the same old problem. More output, less trust.
A report should make decisions easier. If it makes the room more confused, it's not finished.
Turn Reporting Into an Operating System for Organic Growth
The best teams don't treat reporting as a monthly artifact. They use it as a management loop.
That loop looks like this:
- research and planning
- content production
- publishing
- performance monitoring
- refresh and optimization
- budget and strategy decisions
When reporting is built into that cycle, content gets better because decisions get faster.
AI is changing this in useful ways. It can speed data monitoring, flag anomalies earlier, and help translate findings into actions instead of just passive dashboards. That's real leverage for lean teams.
But the caution still matters. AI doesn't fix bad definitions, broken tracking, or weak judgment. It accelerates whatever system you already have. If the inputs are messy, the output just gets messy faster.
For brands trying to scale organic acquisition without adding a lot of manual content workload, connecting workflows and reporting matters more than ever. A platform like Intelliminds can automate topic discovery, article writing, scheduling, publishing, and content refreshing. That doesn't just save time. It can also create cleaner execution data and a steadier reporting rhythm.
The goal isn't more reporting. It's better reporting that helps you grow organic traffic and customer acquisition with confidence.
Conclusion
Effective marketing performance reporting for content ROI does a few things well. It connects publishing and optimization work to business outcomes. It uses a clear metrics hierarchy. It gives leadership a dashboard they can actually use. And it relies on more than one measurement method, because content value rarely shows up cleanly in a single view.
Once reporting shifts from vanity metrics to performance signals, content stops looking like an expense you keep defending. It starts looking like a scalable acquisition system you manage.
If you want a practical next step, audit your current reports. Remove the metrics leadership never acts on. Rebuild around business outcomes and leading indicators. Then create a simple monthly executive SEO reporting format your team can repeat, pressure-test, and improve over time. That's usually where clarity starts.